THE BELL CURVE

      'coin toss' is a famous experiment in probability theory. We always have a fifty percent chance of getting head or tail.

     If you flip the coin 100 times, you may roughly get 50 heads. Suppose you do 100 flips 100 times, what will happen? Sometimes, you get 50 heads, other times 45 heads, or 55 heads, etc. Anyway, it is always around the central value '50' (50%).

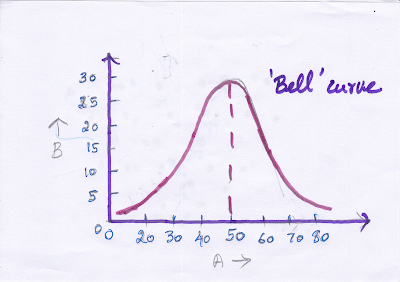
     Let us define 100 flips of the coin as one experiment and let us do 100 experiments. The experimental results are given below. 

      A = number of heads in every 100 flips or in one experiment   

       B =  number of times A in 100 experiments                                         

                    A                  B         

                        100                       0

                        90                         1

                        80                         4

                        70                         12

                        60                         21

                        50                         24

                        40                         21

                        30                         12

                        20                           4

                        10                           1

                         0                            0


         Meaning: We get 100 heads in 0 experiments. 90 heads in one experiment. 80 heads in 4 experiments and so on. Now plot the graph as given below. (Taking A in x-axis and B in the y-axis)

    We get a famous bell curve. The data always cluster around the central or mean value.

Pascal triangle: 

     The pascal's triangle is given here. To build the triangle, start with '1' at the top, then continue placing numbers below it in a triangular pattern. Each number is the numbers directly above it added together. 

See the illustration above for construction.

     Take any row. For example 7th row 1,6,15,20,15,6,1. Draw a bar graph for them.

        You again get a bell curve. If you take a longer row, the accuracy will increase further. So the pascal triangle produces a probability curve. That means the numbers represent a probability experiment like the 'coin toss' experiment.

     [Take the 7th row and add all the numbers.

1+6+15+20+15+6+1 =64

20 30 40 50 60 70 80 - the percentage of getting heads as in coin flip experiment. 

      Correlating the above two rows we understand that if you do 7 flips 64 times, 20 times you may get 50% heads,15 times 40% heads another 15 times, 60% heads, etc. This is one way to interpret the pascal's triangle, another wonder of the triangle.]

Quincunx:

     It is a triangular array of pegs. Balls are dropped onto the top peg and then bounce their way down to the bottom where they are collected in little bins. When there is an equal chance of bouncing left or right, then the balls collected in the bins form the classic bell-shaped curve of the normal distribution.

     This machine is somewhat similar to pascal's triangle. Suppose, you have the same number of rows in pascal's triangle and quincunx. The number of balls collected at each peg in a particular row (quincunx) will be more or less equal to the numbers in the corresponding row of the pascal triangle. So quincunx is a probability machine in action.

  What we have done?:

     The bell-shaped curve represents the probability phenomenon. The curve is exhibited by the coin-flip experiment(graphically). The curve is numerically represented by the pascal's triangle. The curve is physically brought to life by quincunx.

     The bell-curve is everywhere. heights of people, errors in measurements, blood pressure, marks on the tests, all form a bell-curve.

     Our life is ruled by probability and chance.    
Comments

Post a Comment

Popular posts from this blog

LISSAJOUS FIGURES

  Definition:  "When a particle is subjected to two sine wave motion or two oscillatory motion at right angles, the particle describes lissajous figures".      We know sine wave motion and circular motion is basically same.  Hence we draw two circles A and B perpendicular to each other.  The circle B rotates twice faster than circle A.  That is, frequency of circle B is two times than that of A.        A particle at the intersection of two circles is subjected to two sine wave motion   A and B at 90 degree simultaneously.  The particle will describe figures depending on the frequency and phase of A and B .  In our case, the ratio of frequency is  1:2 and the two waves are in phase.        To draw lissajous figures :  A moving point in both the circles are chosen.   Here we should remember; during the time taken by the circle A to complete one rotation, circle B completes two.  Hence the points are marked on the circles according to their speed.  Then straight lines

THE PARABOLA

          A jet of water shooting from a hose pipe will follow a parabolic path.  What is the so special about parabola.    Y= x^2 Draw a graph for the above equation.  It will result in a parabola.  This parabola is also called unit parabola.  Any equation involving square will yield a parabola. Example:  Y = 2x^2 +3x+3 (also called quadratic equation)    X= 2 and -2, both  satisfies the equation 4 = X^2.  Parabolic equations always have two solutions.     Any motion taking place freely under gravity follows parabolic path. Examples:   An object dropped from a moving train,   A bomb dropped from flying plane,  A ball kicked upwards.      If a beam of light rays fall on the parabolic shaped mirror, they will be reflected and brought to focus on a point.  This fact is made use of in Dish Antenna, Telescope mirrors, etc.      Inverted parabola shape is used in the construction of buildings and bridges.  Because the shape is able to bear more weight.      A plane

CASINO'S GAME

           Let us find out how the casino survives with mathematics.      Say, your friend invite you for a game of dice.  You must bet (wager) 2 dollars.  If you roll 'six' you will get back 8 dollars.  The game will go on for 30 rounds.  All sounds good.      The probability of rolling 'six' is 1/6.  Since the game will be played for 30 times, the 'expected win' is 30*1/6 = 5.  That is, you are expected to win 5 rounds out of 30.  Hence your gain will be 5 * 8 =40 dollars.  ok.  This also implies that you will loose 25 rounds.  Hence your loss will be 25*2 =50 dollars.  Your net gain will be gain-less = 40-50 = -10 dollars. For 30 rounds, the loss is -10 dollars, Hence, for one round =-10/30 = -1/3 dollars.  There will be a loss of -1/3 or 0.33 dollars per round.  It is not a fair game.     Let us make a simple formula to calculate  'Pay out per round\. The probability for a win = p The pay-out in case of win = V No. of rounds = n The expect