THE BELL CURVE

      'coin toss' is a famous experiment in probability theory. We always have a fifty percent chance of getting head or tail.

     If you flip the coin 100 times, you may roughly get 50 heads. Suppose you do 100 flips 100 times, what will happen? Sometimes, you get 50 heads, other times 45 heads, or 55 heads, etc. Anyway, it is always around the central value '50' (50%).

     Let us define 100 flips of the coin as one experiment and let us do 100 experiments. The experimental results are given below. 

      A = number of heads in every 100 flips or in one experiment   

       B =  number of times A in 100 experiments                                         

                    A                  B         

                        100                       0

                        90                         1

                        80                         4

                        70                         12

                        60                         21

                        50                         24

                        40                         21

                        30                         12

                        20                           4

                        10                           1

                         0                            0


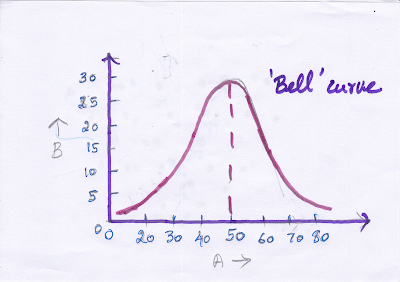
         Meaning: We get 100 heads in 0 experiments. 90 heads in one experiment. 80 heads in 4 experiments and so on. Now plot the graph as given below. (Taking A in x-axis and B in the y-axis)

    We get a famous bell curve. The data always cluster around the central or mean value.

Pascal triangle: 

     The pascal's triangle is given here. To build the triangle, start with '1' at the top, then continue placing numbers below it in a triangular pattern. Each number is the numbers directly above it added together. 

See the illustration above for construction.

     Take any row. For example 7th row 1,6,15,20,15,6,1. Draw a bar graph for them.

        You again get a bell curve. If you take a longer row, the accuracy will increase further. So the pascal triangle produces a probability curve. That means the numbers represent a probability experiment like the 'coin toss' experiment.

     [Take the 7th row and add all the numbers.

1+6+15+20+15+6+1 =64

20 30 40 50 60 70 80 - the percentage of getting heads as in coin flip experiment. 

      Correlating the above two rows we understand that if you do 7 flips 64 times, 20 times you may get 50% heads,15 times 40% heads another 15 times, 60% heads, etc. This is one way to interpret the pascal's triangle, another wonder of the triangle.]

Quincunx:

     It is a triangular array of pegs. Balls are dropped onto the top peg and then bounce their way down to the bottom where they are collected in little bins. When there is an equal chance of bouncing left or right, then the balls collected in the bins form the classic bell-shaped curve of the normal distribution.

     This machine is somewhat similar to pascal's triangle. Suppose, you have the same number of rows in pascal's triangle and quincunx. The number of balls collected at each peg in a particular row (quincunx) will be more or less equal to the numbers in the corresponding row of the pascal triangle. So quincunx is a probability machine in action.

  What we have done?:

     The bell-shaped curve represents the probability phenomenon. The curve is exhibited by the coin-flip experiment(graphically). The curve is numerically represented by the pascal's triangle. The curve is physically brought to life by quincunx.

     The bell-curve is everywhere. heights of people, errors in measurements, blood pressure, marks on the tests, all form a bell-curve.

     Our life is ruled by probability and chance.    
Comments

Post a Comment

Popular posts from this blog

Your heart -you do not know

  Size and Location: The human heart is roughly the size of a clenched fist and is located slightly to the left of the center of the chest. Despite its relatively small size, the heart plays a crucial role in pumping blood throughout the entire body. Heartbeat Variability: The heart does not beat at a constant rate. The interval between heartbeats can vary, and this variability is considered a sign of a healthy heart. Factors such as breathing, emotions, and physical activity influence the heartbeat. Electrical Conduction: The heart's contractions are controlled by electrical impulses. The sinoatrial (SA) node, often called the "natural pacemaker," generates electrical signals that regulate the heartbeat and coordinate the pumping of blood. Blood Pumping Capacity: On average, the human heart pumps about 2,000 gallons (or 7,570 liters) of blood each day. Over a lifetime, this amounts to pumping enough blood to fill several Olympic-sized swimming pools. Heart Chambers and V...

How does your smart phone detect motion, steps, rotation, and location?

 How it works-1  An accelerometer in a smartphone is a microelectromechanical system (MEMS) device that measures acceleration and tilt. It works by detecting changes in motion by measuring the vibration or acceleration of the device. The accelerometer consists of a small mass suspended on a spring inside a sealed chamber. When the device is subjected to acceleration, the mass moves relative to the device, causing a change in capacitance that can be measured and processed by the smartphone's hardware. The accelerometer measures acceleration in three dimensions (x, y, and z) and provides data that the smartphone's software can use to determine the device's orientation, detect motion, and track changes in velocity and acceleration. The accelerometer is used for a variety of purposes in a smartphone, including screen rotation, motion tracking for games and fitness apps, and detecting the position of the device for navigation and location services. Additionally, it can be used t...

How smart watch measures heart rate?

       Heart rate monitors in smartwatches typically use photoplethysmography (PPG) technology to measure the wearer's heart rate. PPG is a non-invasive method that uses light to measure changes in blood volume and flow within the body. In smartwatches, this is usually done by shining light from an LED onto the skin, and then detecting the changes in light that result from the pumping of blood through the veins. The smartwatch typically has sensors that pick up the light reflected from the skin and convert it into an electrical signal, which is then processed to determine the wearer's heart rate. This measurement can be taken continuously, or at specific intervals, to provide a real-time reading of the wearer's heart rate. Why green LED: G reen light has a longer wavelength than red light, which makes it easier to detect changes in blood volume and flow through the skin. This is because the longer wavelength of green light is better able to penetrate the s...