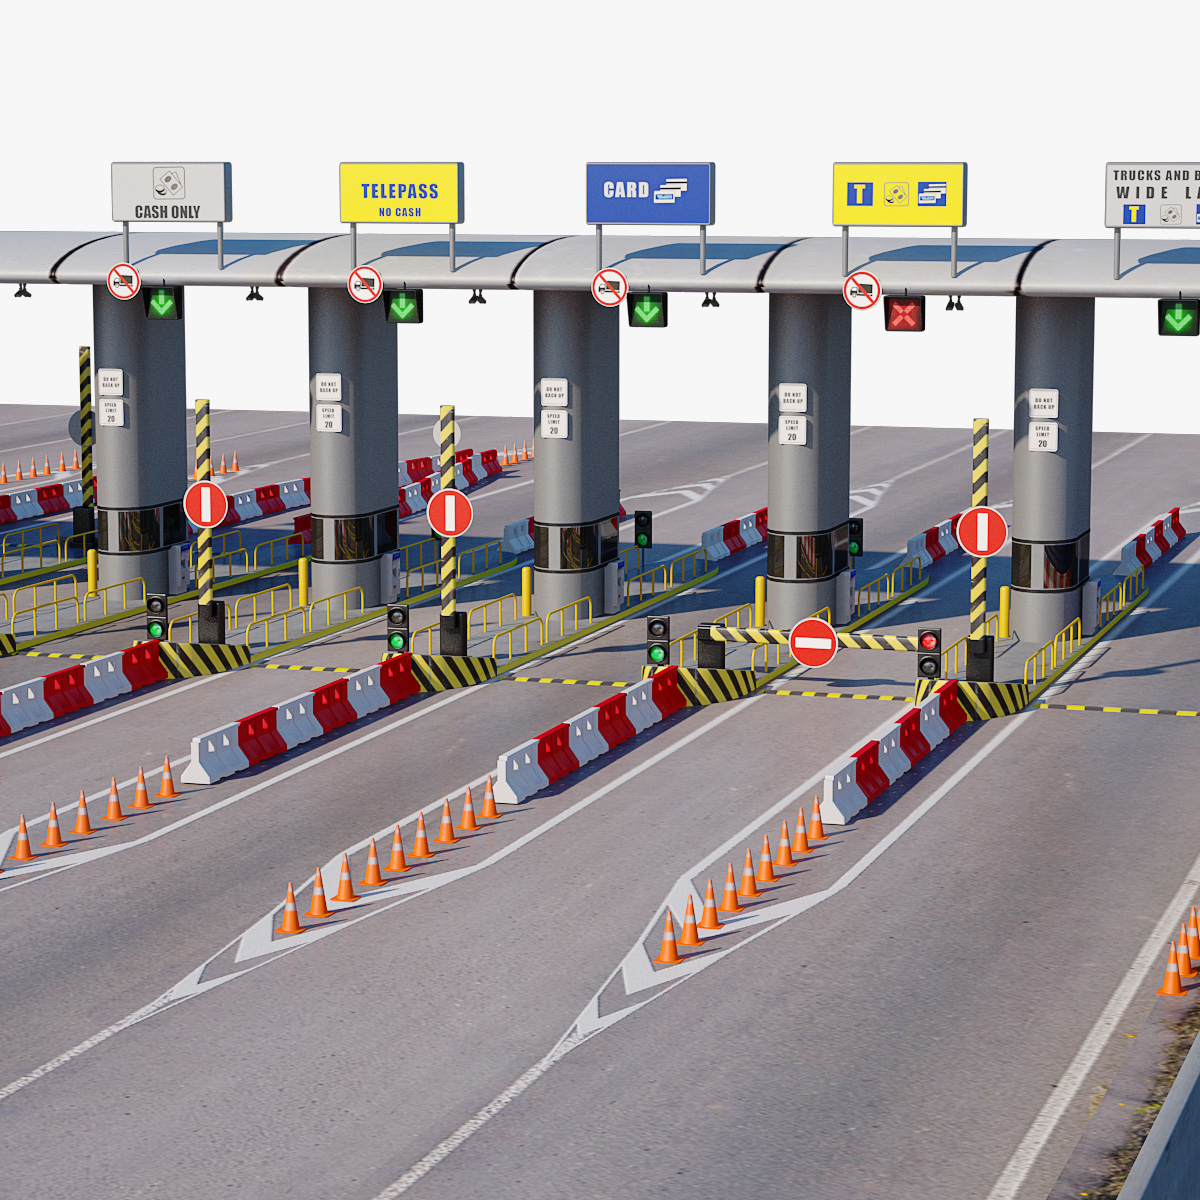
There are four lanes in a toll collection gate (each for back and forth). The administration of toll gate expects to get 15 vehicles in each lane in one hour. But what is seen is,
Lane I -15
Lane II- 18
Lane III -12
Lane IV -11
Now the question is ‘do these measurements confirm our assumption of a uniform distribution?’ There are always some fluctuations in random choice of lanes. But just how much of deviation can we accept before we need to reconsider our assumption? The chi-square test can answer these questions.
Our hypothesis: "The deviations between expected and observed values are not statistically significant". The chi-square test tells this hypothesis is true are not.
CALCULATING CHI-SQUARE:
e1, e2 .... stands for expected frequencies (in our case, it is 15). And h1,h2... stand for observed frequencies for each lane.
Now, x = (h-e) ^2/e
We calculate x for each lane and sum up, we get chi-square.
I lane= (15-15) ^2/12 =0
II lane = (18-15)^2/15 = 9/15 =0.6
III lane = (12-15)^2/15 = 9/15 = 0.6
IV lane = (11-15)^2/15 = 16/15 = 1.06
Adding 0+0.6+0.6+1.06=2.26
That is chi-square.
Next the vehicle can choose any one of the four lanes. Hence the 'degrees of freedom f" is said to be 4-1=3.
We need a chi-square table to look up the critical value. Remember that the chi-square is a measure of reality. So, we should have critical value. Once the calculated chi-square exceeds the critical value, we should reject our hypothesis.
In the table, go to the row determined by the degrees of freedom (3), then go to the column of the probability 0.05 (for beginners). The critical value is read as 7.82. Our value 2.26 is lower than critical value. Hence our hypothesis is true. The vehicles are uniformly distributed in the four lanes.
Note: Chi-square test cannot be used, if observed frequencies are smaller than 5.
Chi-square test is yet another method in statistics helping us to take decisions.
-----------------------------------------------------------------
